Debugging a 3-Second UI Freeze: Tracing a Hardware-Specific Rendering Bottleneck in Chrome
In software engineering, a bug that "only reproduces on one specific laptop" is rarely a hardware problem. It's usually a breadcrumb pointing at an architectural collision nobody designed for.
I ran into one of these last week, on my side project: Panic Design
The Report
A classmate flagged a brutal 3-second UI freeze on dashboard refresh. Only on his low-end HP laptop. Only when Chrome's "Use graphics acceleration" was enabled. My dev rig, other desktops, mobile Chrome — all smooth. Easy to write off as "his machine is just slow." I didn't want to write it off.
Hypothesis 1 — Main Thread Blocking
Cloudflare Turnstile (our bot check) mounted synchronously at the top of the component tree, so I assumed it was blocking first paint. Code-split it, deferred mounting. Result: freeze still happened — just later. Main thread wasn't the culprit.
Hypothesis 2 — Is requestAdapter() Locking the GPU Process?
Chrome logs showed Turnstile probing WebGL texture formats (getInternalformatParameter, requesting RGBA16F). This GPU didn't support 16-bit float buffers, so it threw INVALID_ENUM twelve times, then fell back to WebGPU's requestAdapter(), which came back empty, and Turnstile finally dropped to CPU-based Proof-of-Work.
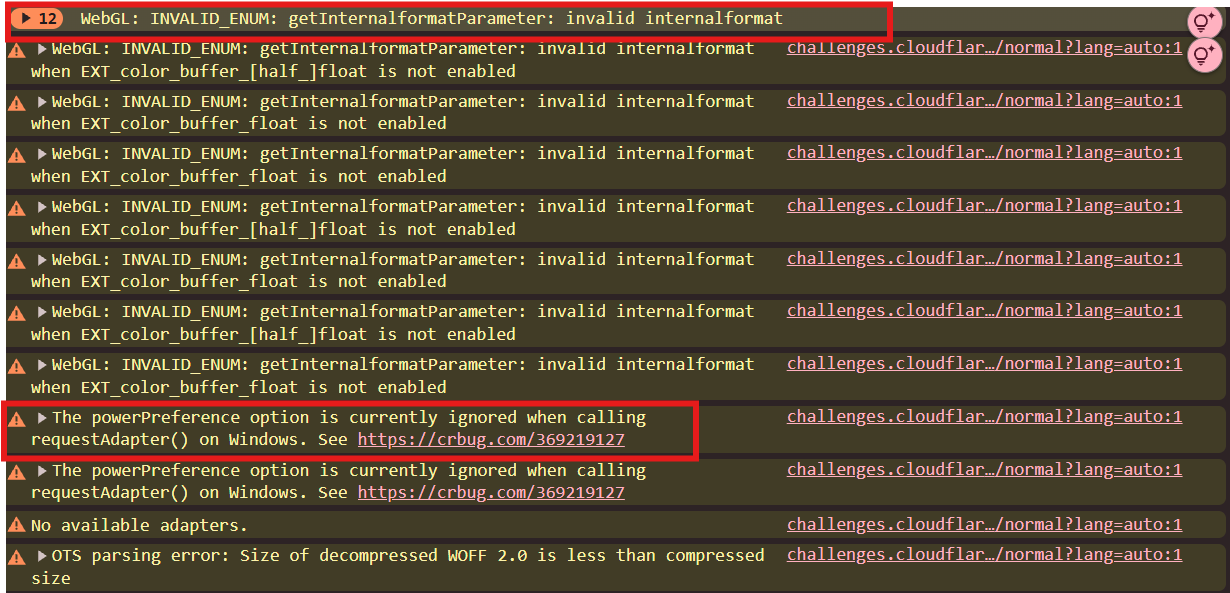
Console log from the affected laptop: 12 failed WebGL probes, followed by two
powerPreferencewarnings that print right as the freeze hits — the moment that first looked like the smoking gun, before the spec ruled it out.
My working theory: requestAdapter()'s driver enumeration synchronously locks the shared GPU Process, so Chrome's Compositor can't produce new frames — scroll and animation commands pile up with nowhere to go.
But a real theory has to survive its own consequences. If that were true, it wouldn't be a one-laptop bug — any device with hardware acceleration on that fell back to PoW would freeze the same way. That's not what we observed. So before trusting the theory, I went to the spec instead: the WebGPU spec confirms requestAdapter() returns a Promise — asynchronous by design, it cannot block the main thread. The two powerPreference warnings in the console just happened to print at the same moment as the freeze — correlation, not causation. Theory discarded. Back to the logs.
The Actual Mechanism
The 12 WebGL probe failures were already ruled out too — they all completed before PoW even started, so they couldn't be gating a freeze that happened during it.
Chrome runs one Renderer Process per tab, but only one GPU Process, shared globally across every tab. During PoW's hash computation, Turnstile also calls WebGL's readPixels() — and unlike requestAdapter(), this one the spec explicitly defines as synchronous. That call forces an immediate flush of the entire GPU command queue. On a weak GPU/driver, that flush took hundreds of milliseconds.
The problem: the Compositor's frame-output commands — the ones driving scroll and CSS animation — sit in that same shared queue. readPixels() starved it, so the screen froze for ~3 seconds, even though React had already finished rendering and the JS main thread was idle.
Turning hardware acceleration off "fixed" it by accident: WebGL fell back to SwiftShader (pure software), readPixels() returned in microseconds, and the Compositor never touched the GPU Process at all — no shared queue, no starvation.
The Fix
Once the mechanism was clear, it stopped being a mystery and became a scheduling problem:
- Switch Turnstile to
execution: 'execute'(invisible mode) — PoW only runs on click, never silently on idle. - On click, before calling
.execute(), yield one frame viarequestAnimationFrame+setTimeoutso the browser paints a static "Verifying..." state — no CSS animation, nothing that touches the Compositor — before the GPU queue gets locked.
One subtle trap along the way: never write a consumed Turnstile token back into state to "save" it — tokens are single-use, and doing so silently creates a double-spend bug.
Insights panel (LCP / INP 68ms / CLS 0, INP circled) + Frames row directly below it, red boxes on the 83.3ms / 133.2ms / 133.3ms intervals, filmstrip trimmed to 2–3 representative frames.
Post-fix, same laptop: INP for the Generate Key interaction lands at 68ms. During the static "Verifying…" state, frame intervals stretch to 5–8x a normal vsync (83–133ms) — because nothing's animating, so the compositor has nothing to repaint. The GPU queue stays idle exactly when Turnstile's PoW would otherwise be fighting it for flush time.
Closing Thoughts
None of the individual facts here were secret — sync readPixels(), one shared GPU Process, both documented behavior. What's never written down anywhere is how they collide, on one specific piece of hardware, inside one specific vendor's PoW loop. That collision is what "debugging" actually means once the easy explanations — bad laptop, slow driver — have already run out.
Here are the resources for those who want to dig into the code or test the gateway:
👾 Live Demo: https://panic.andrewwangdev.com
💻 GitHub Repo & Commits: https://github.com/AndrewWangDev/panic_design
Discussion
Please login to join the discussion
Go to LoginNotice
Are you sure you want to delete this comment?